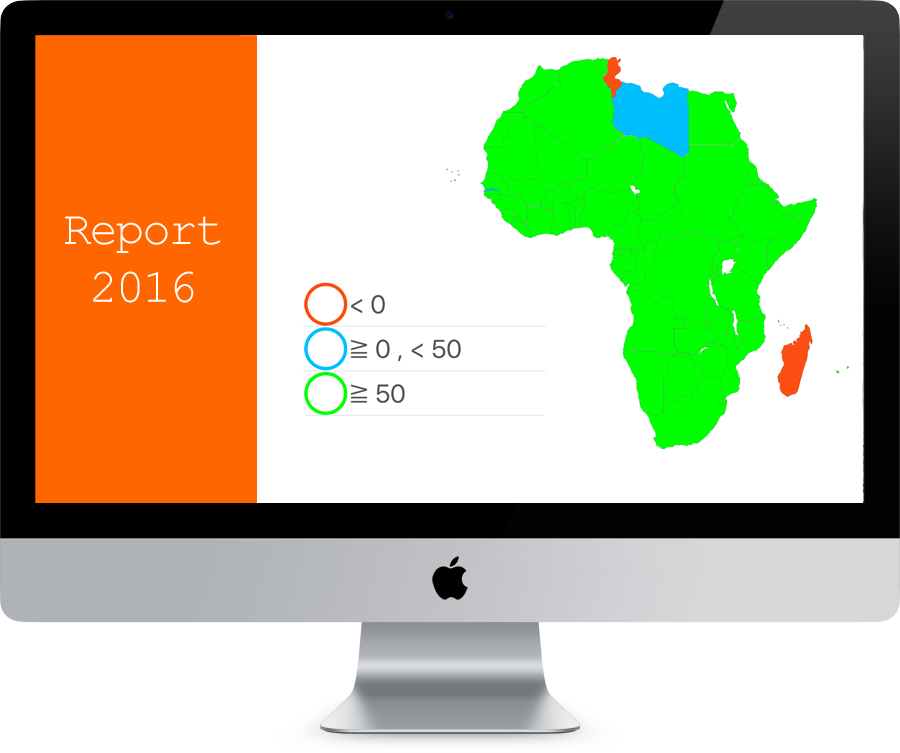
So you need to represent on map some intervals, some statistics and you need to do it quickly, for your report...it is a good thing you found Thematics+! Just with few gestures you will be able to print or export a perfect image of your data organized on a world map. You chose which group of countries, which color and/or value and the job is done.
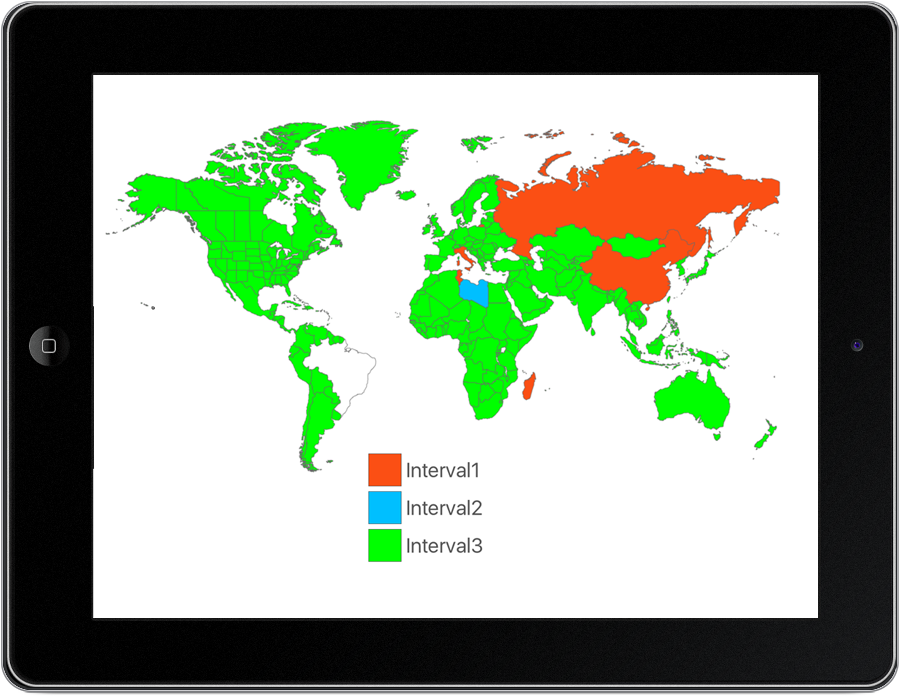
Add clarity to your presentation with a customized map. Whether you are representing sales data or the location of your headquarters worldwide, you will find in this app a must-have-tool.
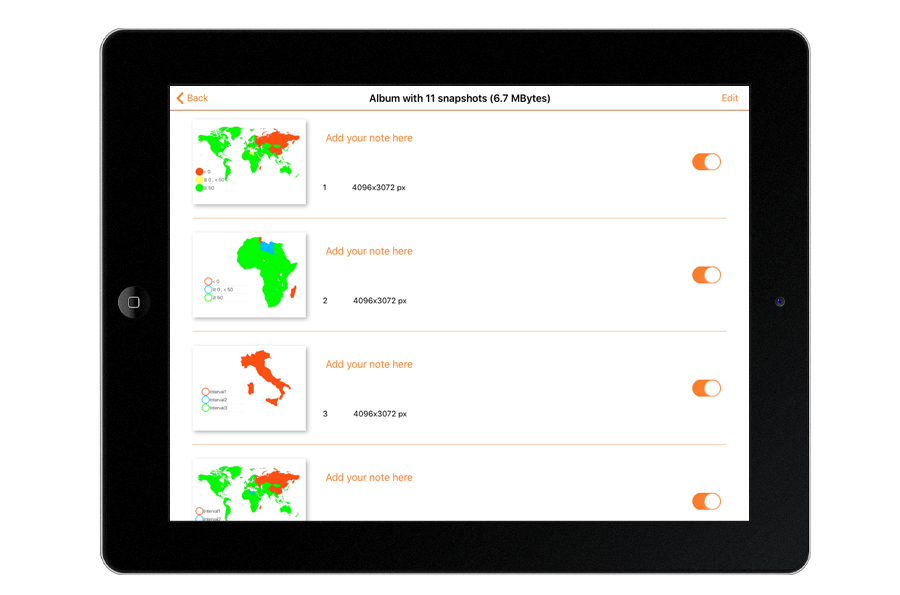
If all you need to communicate is a series of pictures of different maps with some comments, Thematics+ does it for you. Just take the snapshots and publish the photo album.